Understanding audience discovery metrics on Spotify

Discovery and impression data helps you understand how and when your show appears to potential fans in the Spotify app, and how they interact with or listen to your show after seeing it.
To view show-level discovery and impressions:
- Log in to Spotify for Creators
- Go to Analytics then Discovery.
To view episode-level discovery and impressions:
- Log in to Spotify for Creators
- Go to Episodes and select an episode.
- Under Analytics select Discovery.
Note: This data only counts people who discover and listen to or watch your show on Spotify.
How traffic leads to consumption
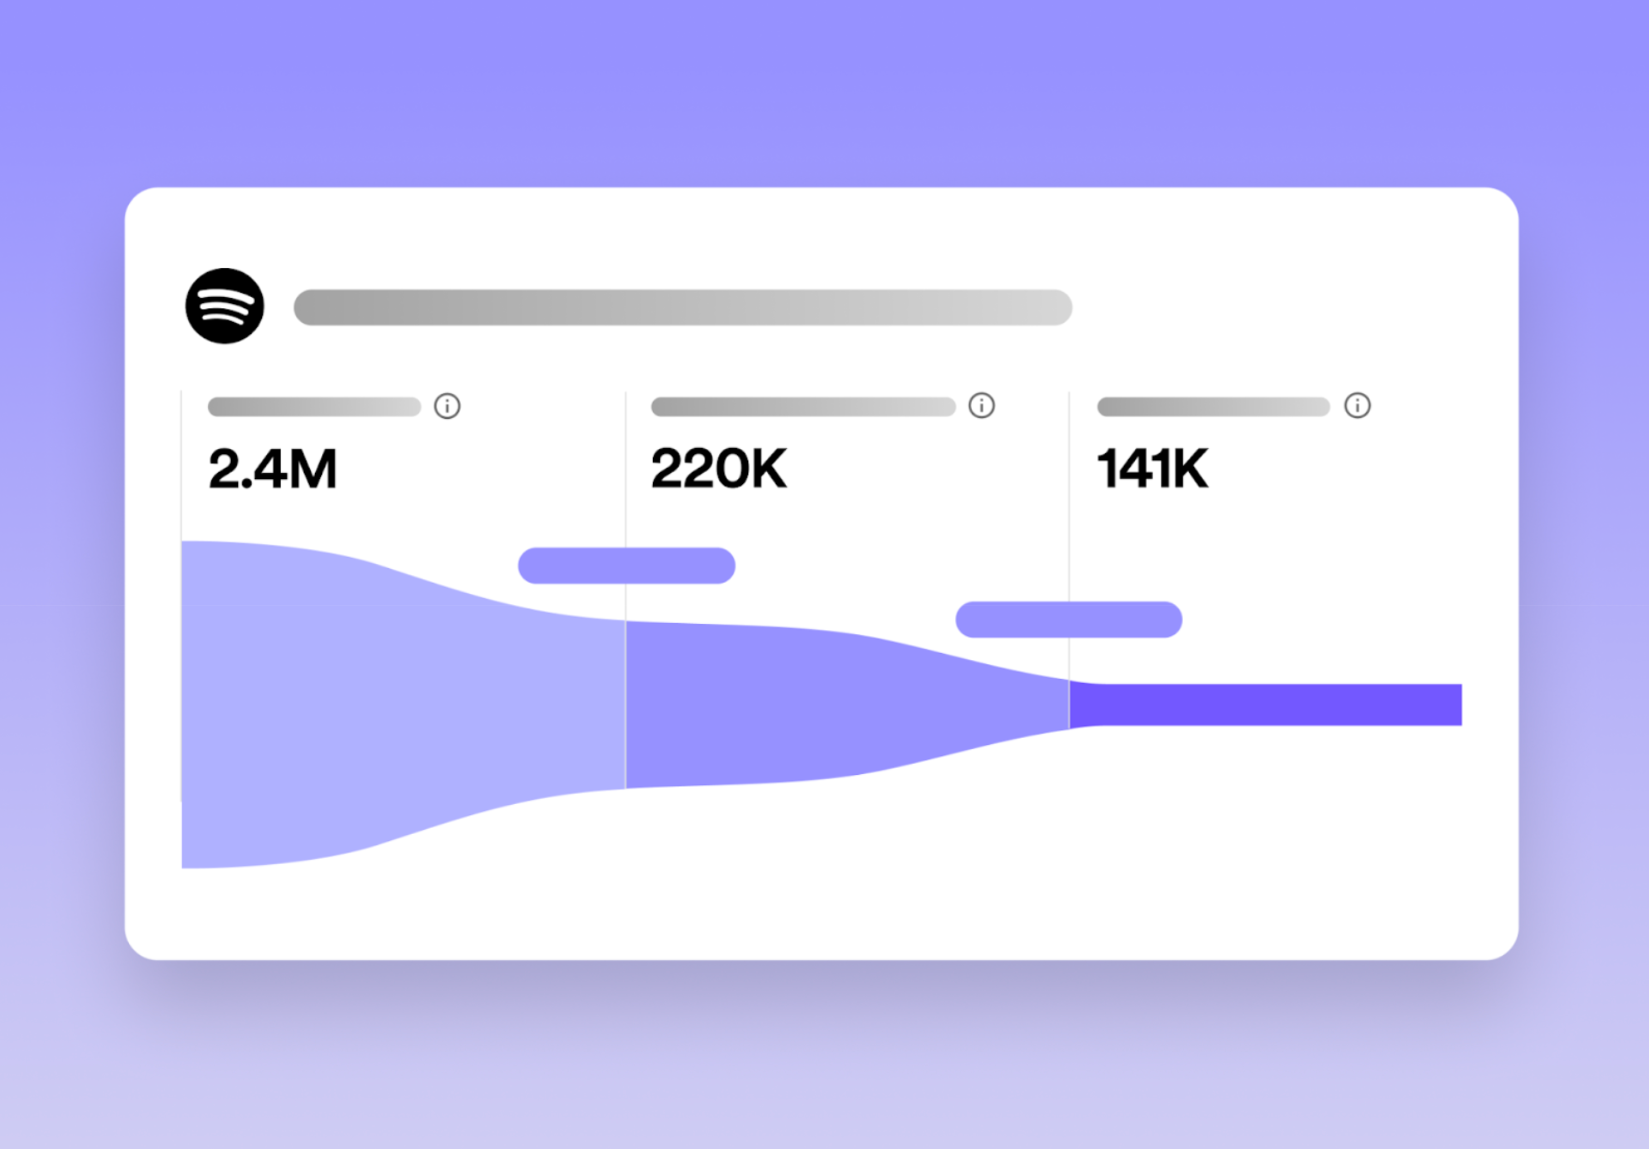
The audience journey visualization shows the number of people who interact with, listen to, or watch your show after seeing it on Spotify.
This visualization is only available once your show has at least 10 people who listened or watched your show in the date range shown.

People you reached counts every person who your show appeared to on Spotify. This is sometimes called an impression.
People who showed interest counts Spotify users who:
At show-level:
- Visited your show page or episode page on Spotify
- Played any episode. Learn more about how we count plays
- Liked or added your show to a playlist
- Followed your show
At episode-level:
- Visited the episode page on Spotify
- Played the episode. Learn more about how we count plays
- Liked or added the episode to a playlist
People who consumed shows the number of listeners or viewers who went on to play your show for 60 seconds or more after seeing it on Spotify.
The data only shows actions from the last 30 days and can take up to 48 hours to refresh.
Key stats
You’ll be able to see key stats for the same time period to help you better understand your total listenership and conversion of followers during this time.
Your key stats will specifically show you (during the specific time period):
- How many people consumed your content on Spotify
- The average amount of hours that your show was consumed per person
- The percentage of people that listened or watched your show that also follow your show
The data shown is from the last 30 days and can take up to 48 hours to refresh.
Where impressions come from
When somebody sees your show, episode, or clips on Spotify it counts as an impression.
Source within Spotify | Examples |
|---|---|
Home | Recommendations, recently played shows, and previews |
Library | Saved shows or episodes and user-created playlists |
Search | Search queries (such as people searching for your show title), top charts, and our editorial recommendations |
Interpreting impressions data
Impressions typically rise and fall with episode release schedules.
If your show’s impressions are high compared to its plays, this could mean lots of people on Spotify are seeing your show but they aren’t clicking through to it.
Try viewing your total impressions over time, using the Traffic charts in Spotify for Creators to identify performance trends. It's often best to wait a week after an episode’s publish date to understand the total amount of impressions it gathered.
Take a look at the Where people find your content graph to understand exactly where on Spotify your show appears the most. Consistently checking this graph and seeing how it changes from episode to episode can be insightful.
For example, you might discover that you're receiving lots of impressions via Search. That could mean more listeners are searching for your show title, so you could consider creating compelling cover art to stand out.
FAQs
- Understanding engagement metrics on Spotify
- Audience stats
- Audience retention
- Understanding audience discovery metrics on Spotify
- Podcast charts on Spotify
- Video analytics
- Link sharing and referral data in Spotify for Creators
- Understanding your Spotify Partner Program analytics
- Subscription analytics
- Downloading your show's analytics data
- Data changes after switching to Spotify for Creators